Usage Analytics - School Analytics Dashboard (Enterprise)
Usage Analytics displays school statistics and user logs for all users at your organization. Usage Analytics (formerly School Analytics) uses a system that provides better insights into the overall adoption of Schoology at the district level and exports the data at scale.
Access Usage Analytics
- Click Tools in the header.
- Click Usage Analytics.
Usage Analytics displays a Schools tab and System Logs tab. The Schools tab displays usage analytics for all users in your organization and summary data for course materials. The System Logs tab enables you to view a running log of actions performed by individuals at your school or organization.
Administrators with the View School Analytics permission enabled will have access to data captured only within buildings associated with their account.
School Analytics Dashboard
The School Analytics dashboard displays usage analytics for all users at your organization and summary data for course materials. The dashboard displays data up to the previous 24 hours and can be viewed on the web and on the Schoology mobile app (tablet only).
Filter Data
Use the filter options on the Usage Analytics page to refine the data that displays.
- Schools - An administrator can filter by buildings associated with their account. If there is only one building associated with the account, no building filter is displayed. If multiple buildings are selected, the cumulative data is displayed for those buildings, not data per building.
- Role Type - All roles in your organization are available in this filter.
- Date Range - Use the calendar to filter usage data by a selected time range. You may also select preset time range filters–Last 7 Days, Last 30 Days, and Last 12 Months. The maximum selected date range is 13 months.
Active Users
This feature is in limited availability.
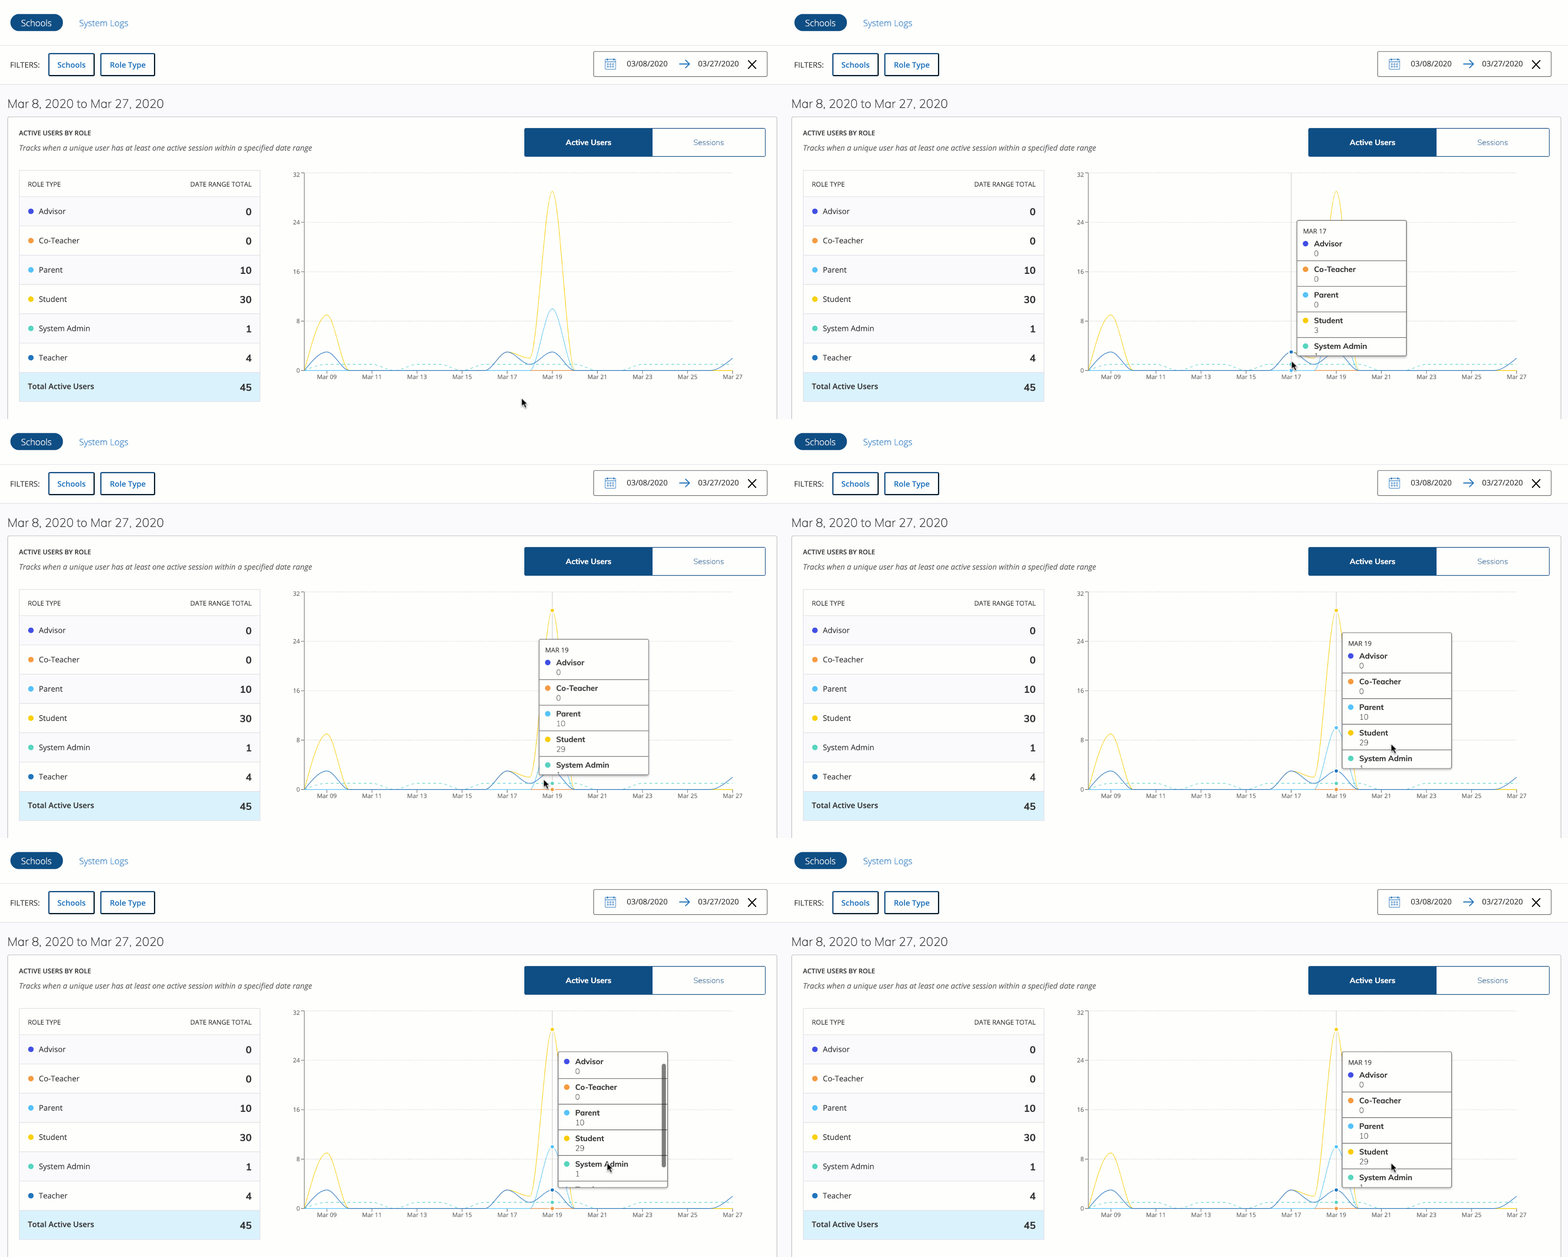
Click Active Users on the usage chart to display when a unique user has an active session within the selected date range.
Roles are displayed in alphabetical order. Only one active session per unique user is displayed here i.e. multiple sessions per user are not displayed.
The usage chart displays the usage by role over time. Hover over the graph to display the usage per role for each date or date range.

- Usage by Role - Displays total active users in your organization based on selected filters.
- Usage Chart - Displays active users by role over time.
- Course Materials Created - Displays creation data for all course materials.
Course Materials Breakdown - Displays submission and views data for all course materials.
Click Clear All to refresh your search and select different school buildings and/or roles. Alternatively, select Clear from the Schools filter.
Sessions
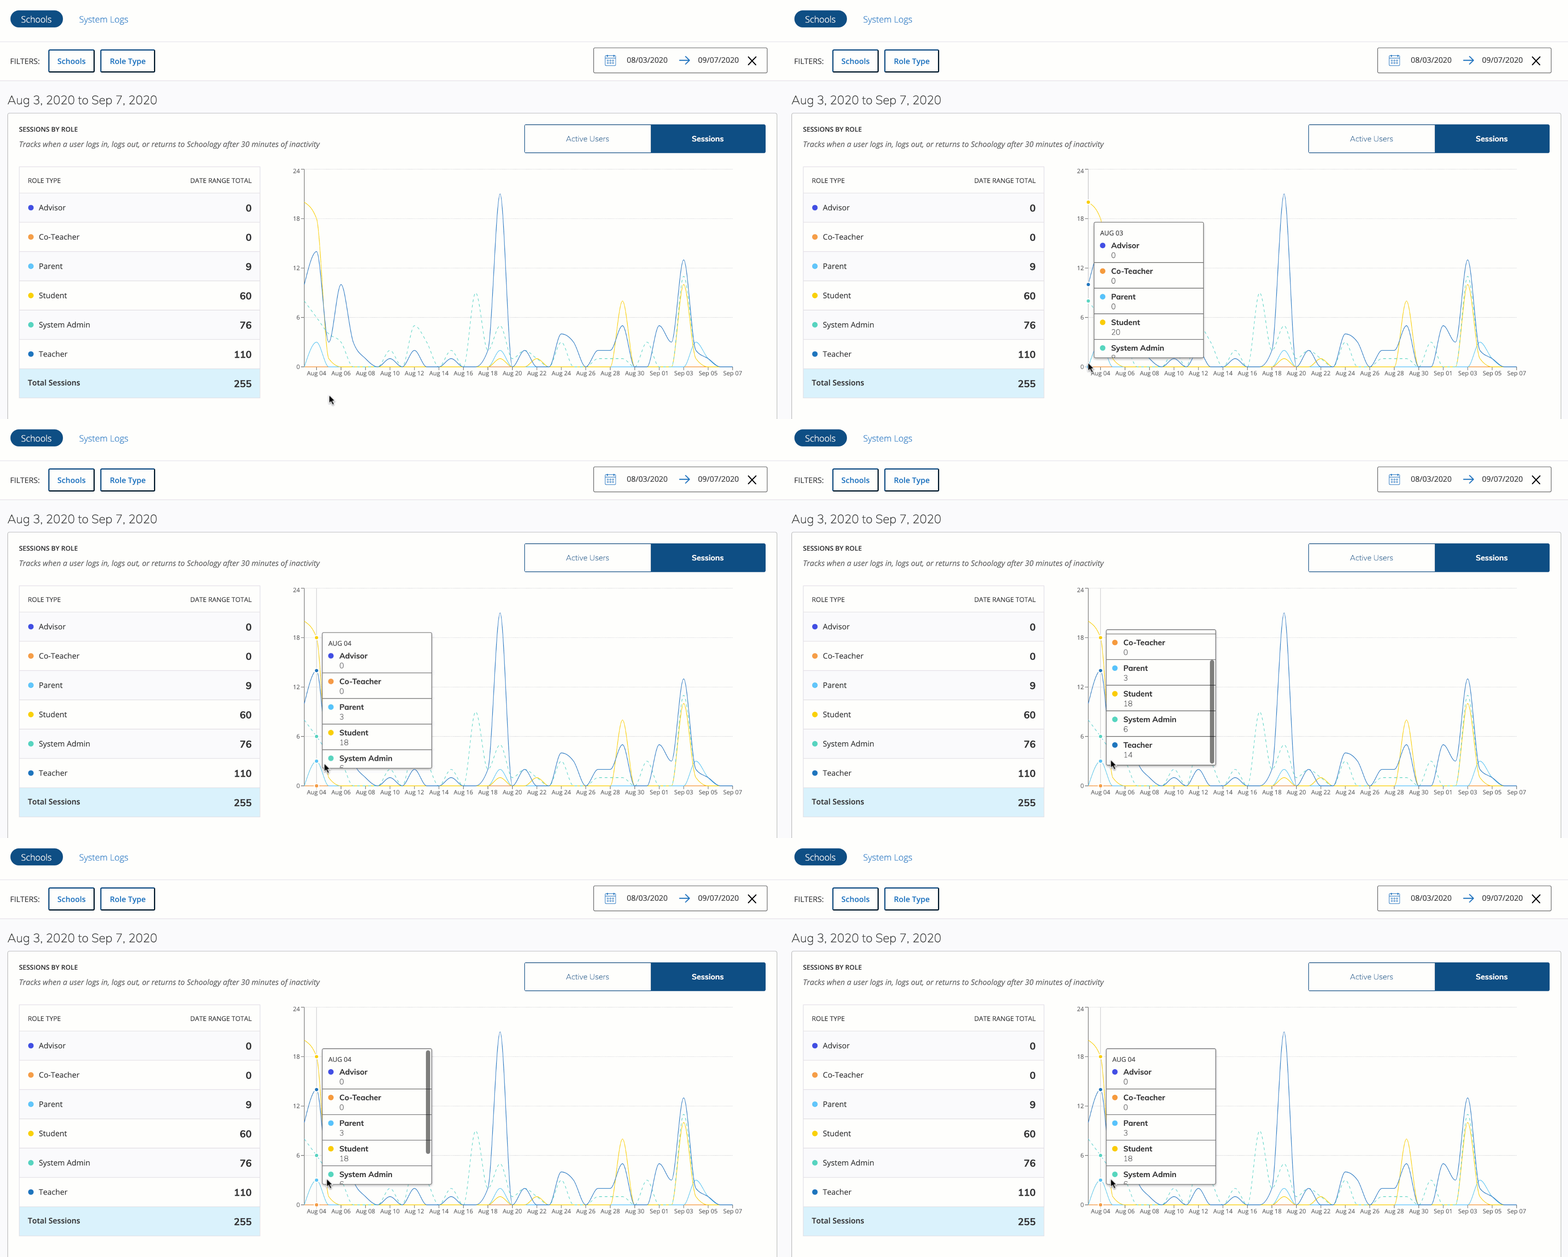
Click Sessions on the usage chart to display user logs in, logs out, and returns to Schoology after 30 minutes of inactivity.
The Sessions by Role table displays the role type and the date range total per role.

Click Clear All to refresh your search and select different school buildings and/or roles. Alternatively, select Clear from the Schools filter.
Course Materials Created
The Course Materials Created chart displays data for the total number of course materials created.
Materials are displayed in descending order and they can be filtered by school building and date range. The Role filter, and the Active Users and Sessions view do not affect this chart. You may filter by Schools and Date Range only.
Course Materials Breakdown
The Course Materials Breakdown table displays cumulative submissions and views data for all course materials.
Materials are displayed in descending order and they can be filtered by school building and date range. The Role filter, and the Active Users and Sessions view do not affect this table. You may filter by Schools and Date Range only.
System Logs
The System Logs tab enables you to view a running log of actions performed by individuals at your school or organization. User activity from the mobile app is not included in the System Log area of School Analytics. Mobile web data is included in System Logs.
System Log Information
The system logs display the following information:
- User - The name of a user at your school or organization that is associated with the type of action that was performed. Click on the name to navigate to the user's profile.
- Source IP Address - The source IP address we retrieve over the internet from a device or network from which the type of action was performed.
- Browser - The browser information (type and version) from which the type of action was performed.
- Timestamp - Displays the date and time at which the type of action was performed. The timestamp is displayed in the local time zone for your account, as configured in your Account Settings.
- Type - Displays the type of action performed by the user. Hovering over the link with your mouse will display additional information about the action.
Exporting Analytics
System administrators can export usage data as a CSV file for any data captured after August 1, 2019. This export includes all buildings in your district.
Administrators with the View School Analytics permission enabled can export data captured after August 1, 2019, only within buildings associated with their account.
- On the User Analytics page, click Actions.
- Select Export Report from the menu.
- Select a date range to include in the export.
- Click Next.
Click Export Report to confirm your changes. An email notification with a download link will be sent when the file is ready. If the export fails, an email notification is sent to the system administrator that initiated the export.
Analytics are exported as a GZip file. GZip is a compressed archive file. To view the export file, your device should automatically expand the file and view it as a CSV file, similar to unzipping a ZIP file. If the file is not automatically expanded, you may require third-party file archiver software.
Each row in the CSV represents:
- A user
- An action
- A day
- A total count of actions for that day
- A timestamp (UTC format) for the last action of this type performed on that day
Download the School Analytics Data Values document for details on the data values in the export file.
Auto-Export Analytics
This feature is in limited availability.
System administrators can opt to set up an auto-export for usage data captured after August 1, 2019, to deliver to an SFTP server. There is no method to customize the data within the export and you may only set up one auto-export for your organization. This feature is not supported on Internet Explorer and Edge.
You can set up an auto-export from the Auto Export tab on the Usage Analytics page. Administrators with the Administer school permission enabled can auto-export data captured after August 1, 2019 only within buildings associated with their account. If you require an auto-export for the entire organization, the organization-level building must be associated with your account. All auto exports run daily at 12:00 am. You cannot edit the day and time of the auto export.
- Click Tools in the header.
- Select Usage Analytics.
- Click Auto Export.
The Auto Exports area displays all scheduled export, including:
- Export name: The name of your export.
- Export schedule: The frequency of your export.
- Last Export: The date and timestamp of the latest auto-export.
- Click Add Auto Export.
- Select SFTP for Export. If your organization already has an SFTP configured, skip to the next step to select your SFTP. If your organization does not have an SFTP server configured and this is your first time setting up an auto-export, you can configure the SFTP from the Auto Export area.
- On the Auto Report Export page, click Add New SFTP.
- Enter the details to set up SFTP configuration.
- Click Save.
- Select your SFTP from the SFTP drop-down menu.
- Enter the file path for where the export will be sent to.
- Click Next. If you need to cancel the auto export setup, click Cancel.
- In the Export Name field, enter a name for your export.
- Click Next.
- Confirm the information is accurate for your auto report export. Once confirmed, this export cannot be edited. If you need to make adjustments to your report, use the Previous button to amend any of the previous steps.
- Click Create Export to confirm and complete the auto-export setup. If you need to make any changes to the report after it’s confirmed, you must delete the report and create a new one.
The export will automatically run at midnight in your organization’s time zone and then subsequently every day at midnight. Auto-exports are sent to your selected SFTP location as a zip file and labeled with a date and timestamp. There is no method to customize the data within the export.
Delete an Auto-Export
If you need to make changes to an auto export, you must delete the report and create a new one.
- From the Auto Exports area, click the three vertical dots next to the report.
Click Delete Export.
Frequently Asked Questions
Is mobile app data included in Usage Analytics?
While mobile app data is included in the analytics displayed on the Schools tab, it currently is not included in the System Logs tab. Mobile web data is included in both Schools and System Logs i.e. activity from the mobile browser.
Is AMP (Assessment Management Platform) data included in Usage Analytics?
Managed Assessments (AMP) data reports can be viewed in the Assessment Reports area.
I'd like to find more specific user data about activity within courses, where I can see which students have accessed materials and their submission data, is that available in Usage Analytics?
Consider using Course Analytics for the course-level user activity.
