Data Dashboard
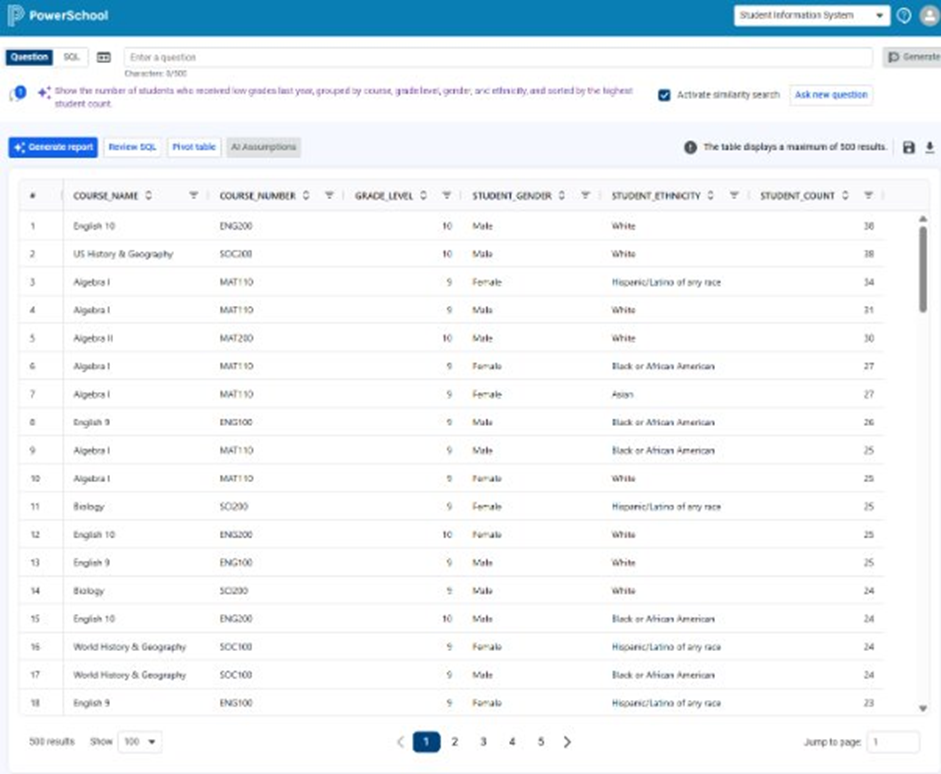
The Data Dashboard is the central page where you can ask natural language (NL) questions about your data and get the SQL queries generated by PowerBuddy for Data Analysis. You can also write your own SQL queries and get the data for analysis.
Getting started
-
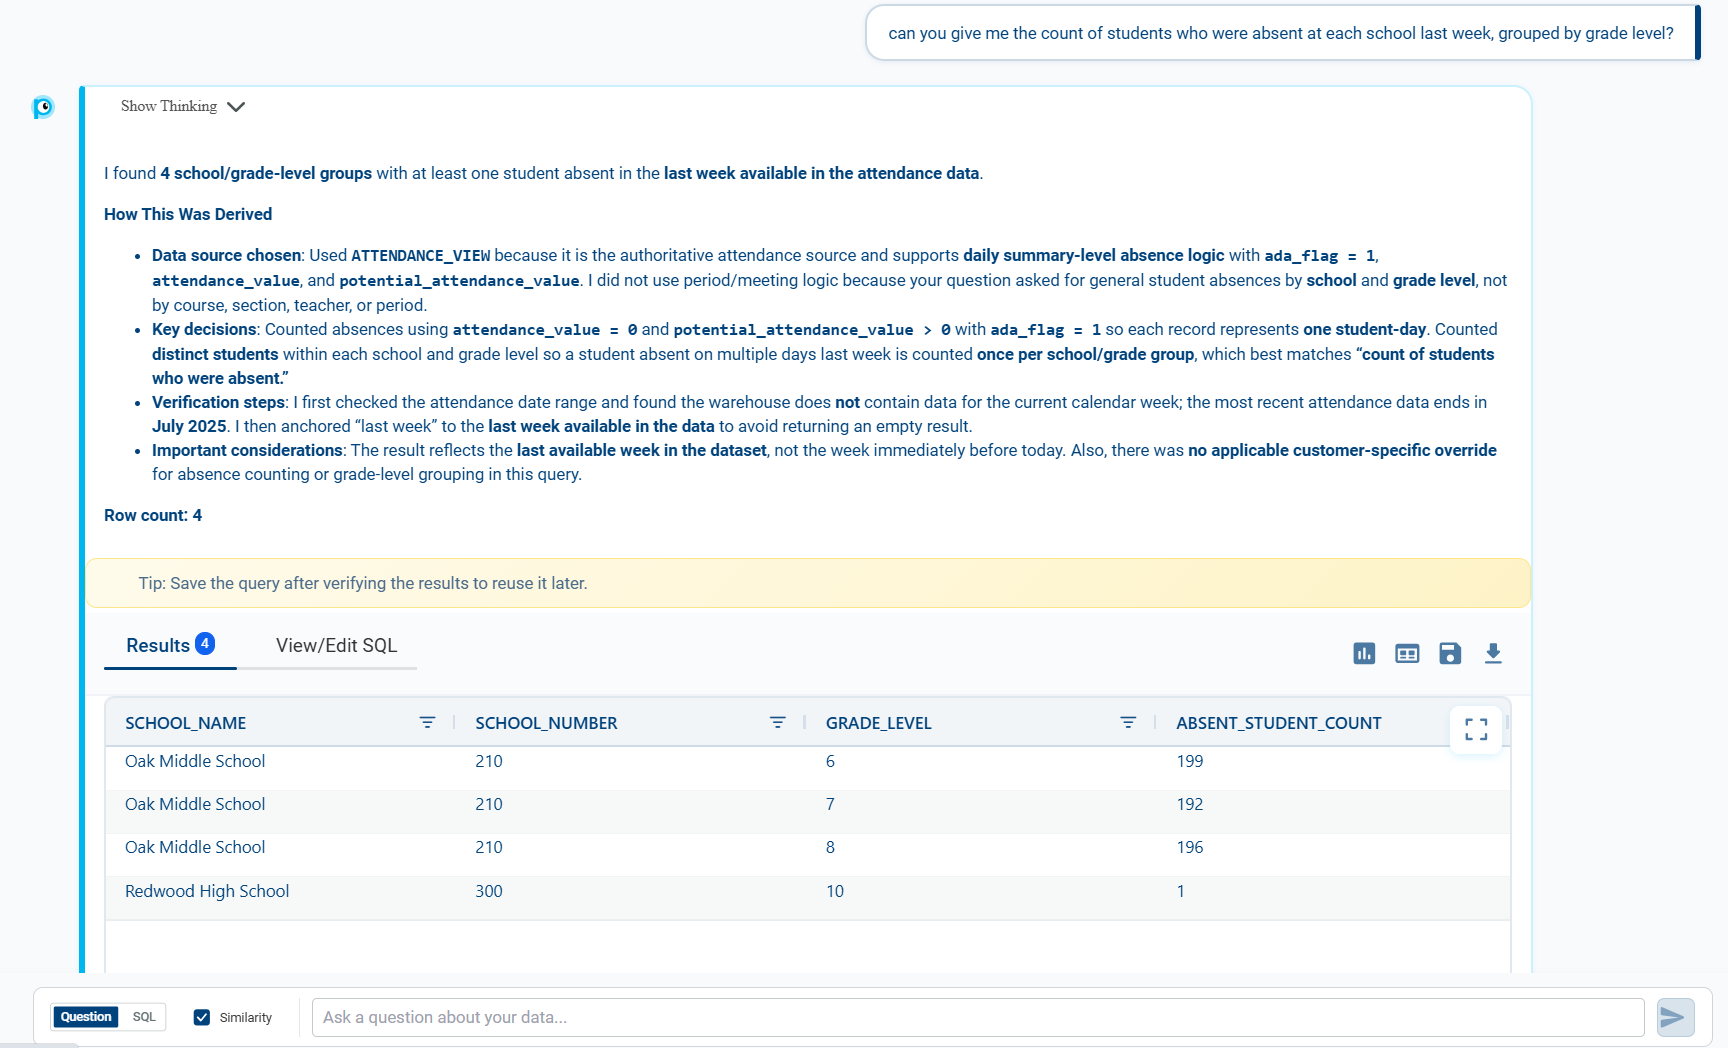
Type a natural language question in the Enter a question text box and either press enter or click Generate.
You can also start by selecting a question from the list of Sample questions on Data dashboard. The results appear below this chat area. -
Review the generated explanation that highlight key assumptions, filters, and reasoning used to derive results.
-
To make updates or further refine your data, ask follow-up questions by entering them into the same text box. The rephrased AI query includes the entire context from your previous questions.
-
Click Download data to save a copy of the results.
-
To ask an entirely new, unrelated question click New chat.
Click on the SQL toggle to enter your own SQL query
Pivot Table
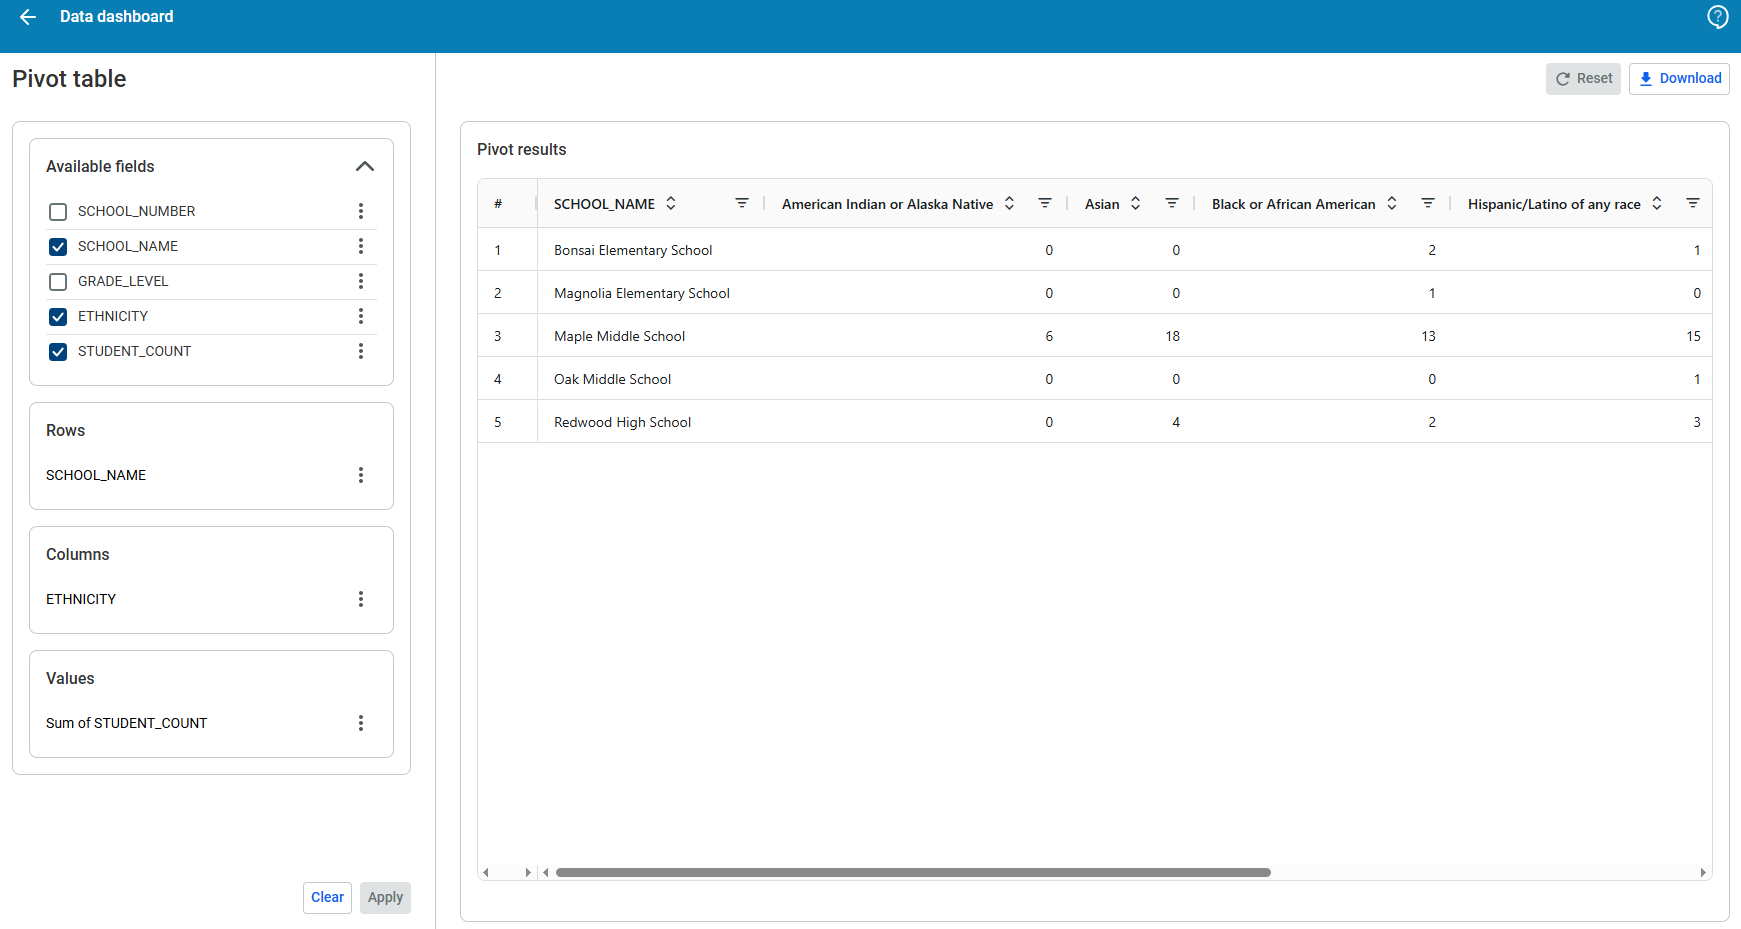
The user-driven pivot table feature allows you to create flexible pivot tables directly within PowerBuddy, making it easier to group, summarize, and explore data across different dimensions without having to export data outside of PowerBuddy to create pivot tables.
By default, PowerBuddy displays unpivoted data, and the SQL query is generated for this format.
Users can download the unpivoted or pivoted data based on the selection.
Pivoting improvements will be included in the future releases.
Once a user creates a pivot table and saves the corresponding question, the pivot settings are saved as well and will automatically load when the saved question is run again.
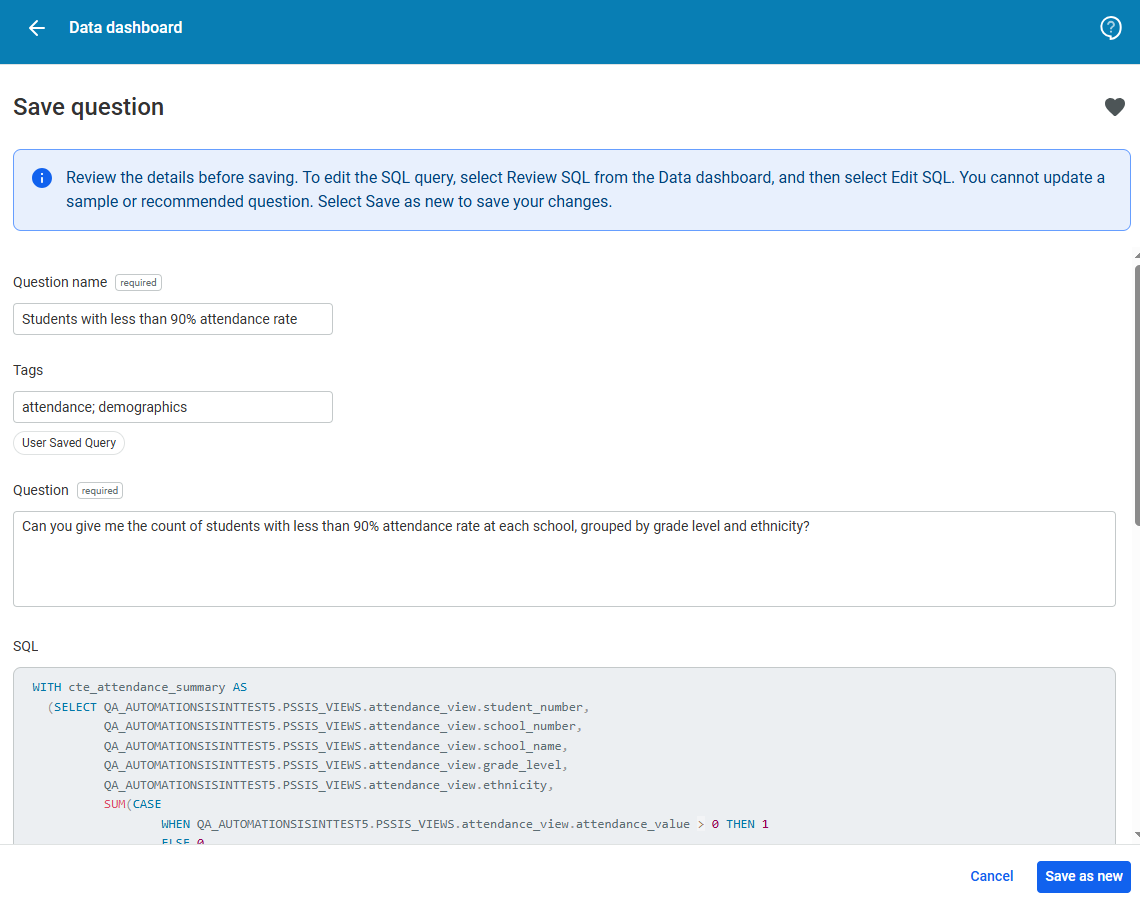
Save SQL
-
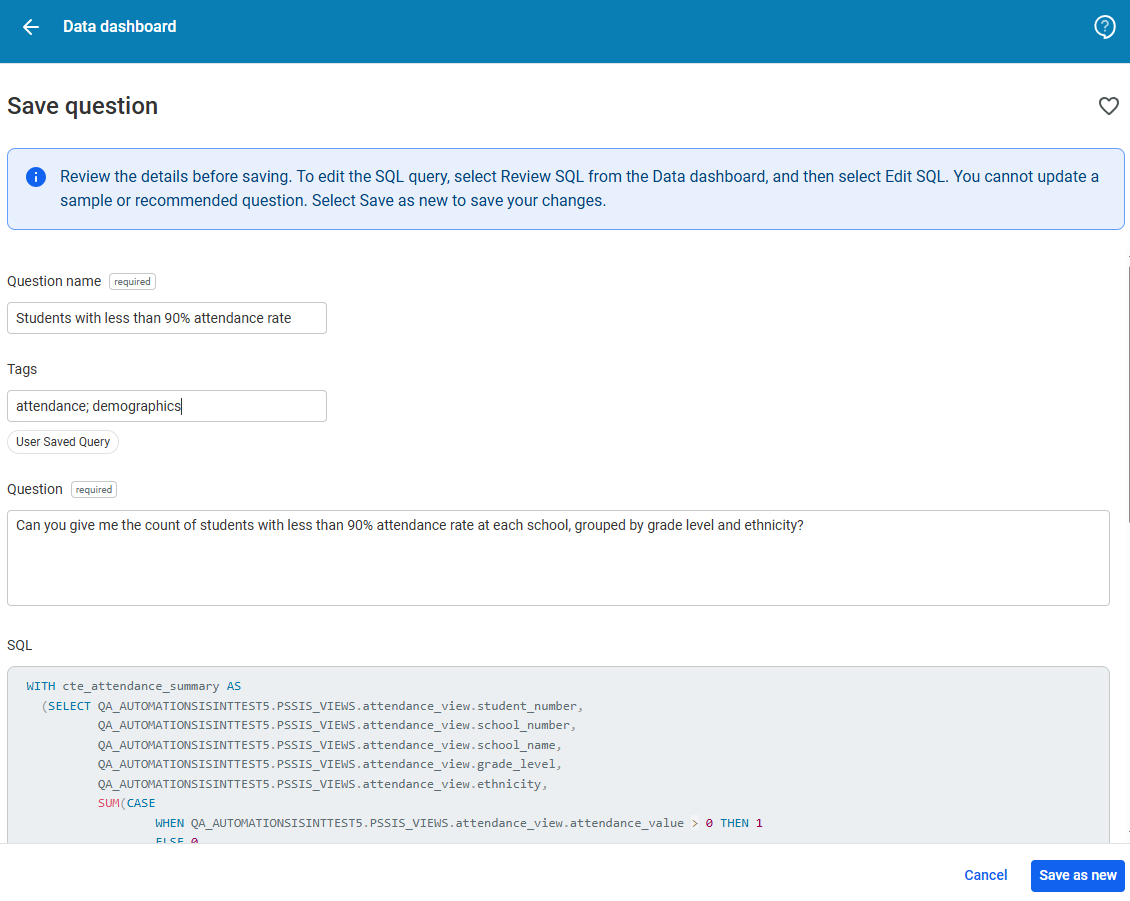
Click Save button on Data dashboard and enter a Question name to add a short name or title to your saved queries.
-
Add custom tags in the Tags field separated by semi-colons. User Saved Query is the default tag that will be added to indicate queries are saved by users.
-
Review the AI-generated user query in the Question field and update it as needed.
-
Review the SQL query in the SQL field. You can edit the SQL query by clicking Review SQL from the Data dashboard, and clicking Edit SQL. If you make any modifications, make sure that the Question name and Question associated with the modified SQL query is still relevant, then click Save as new.
When a 'User Saved Query’ is run from Question vault or when the entered natural language question closely matches a user saved query, the Save SQL page shows options to either update (replace) or save it as new.
Saving the queries ensures that you can access and retrieve them without having to regenerate it every time.
Favorited Questions
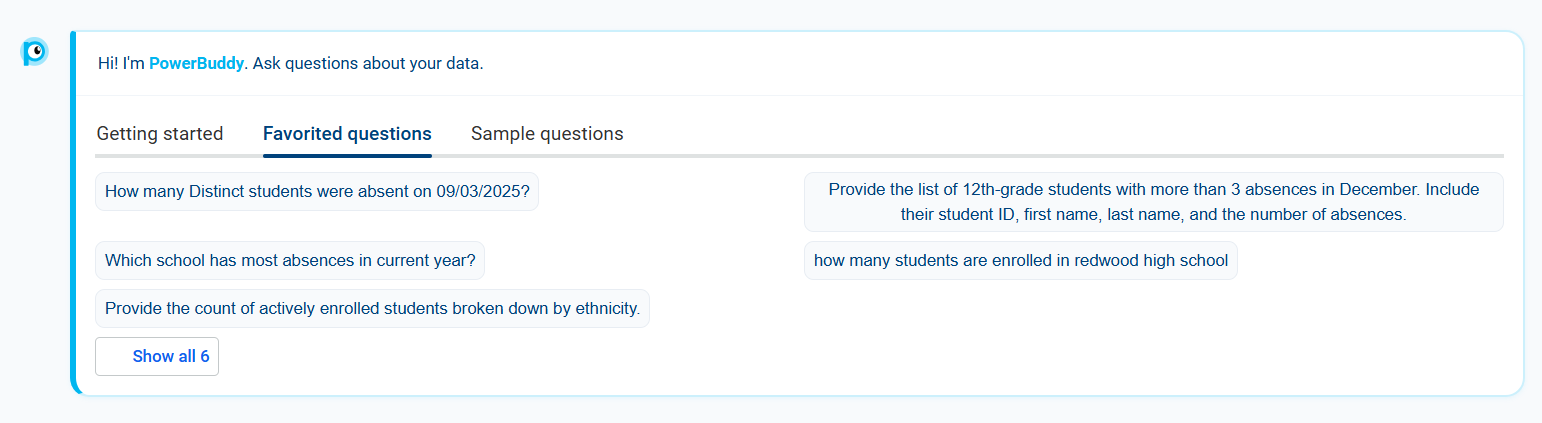
Allows users to mark important or frequently used saved questions as favorites for quick access from the homepage.
Questions can be favorited from question vault or while saving as a new query. To remove a favorited question, click on the heart icon again in the question vault.
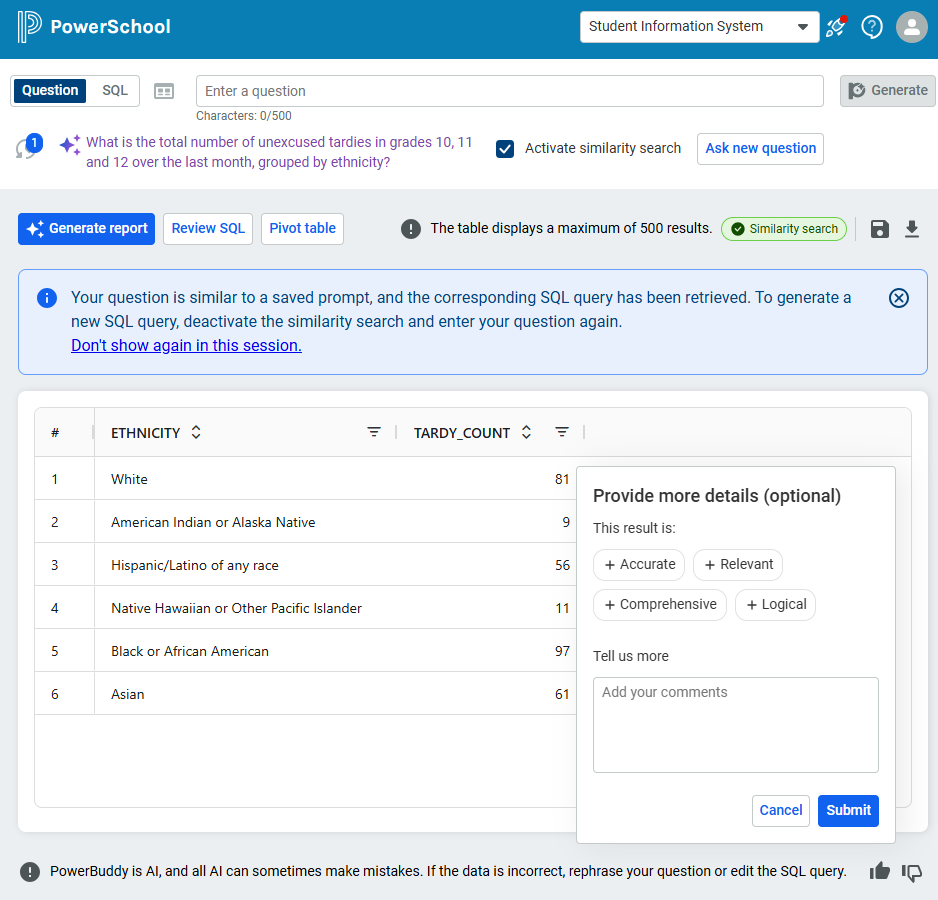
Deactivate similarity search
Turning off the similarity search provides the flexibility to generate new SQL queries, rather than running saved SQL queries.
-
Uncheck the Activate Similarity Search checkbox to disable similarity search.
-
Enter your question again.
This ensures that PowerBuddy generates a new SQL query that accurately reflects the entered prompt.
Guidelines for writing natural language questions
-
PowerBuddy for Data Analysis is designed to work well with questions in a natural, conversational manner. You are encouraged to naturally converse with PowerBuddy using the chat to interact and clarify your questions.
-
Asking specific questions ensures more accurate and relevant responses.
-
Wherever possible, including timeframes or specific conditions in your questions can help narrow the scope of the response.
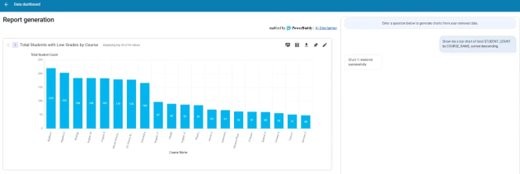
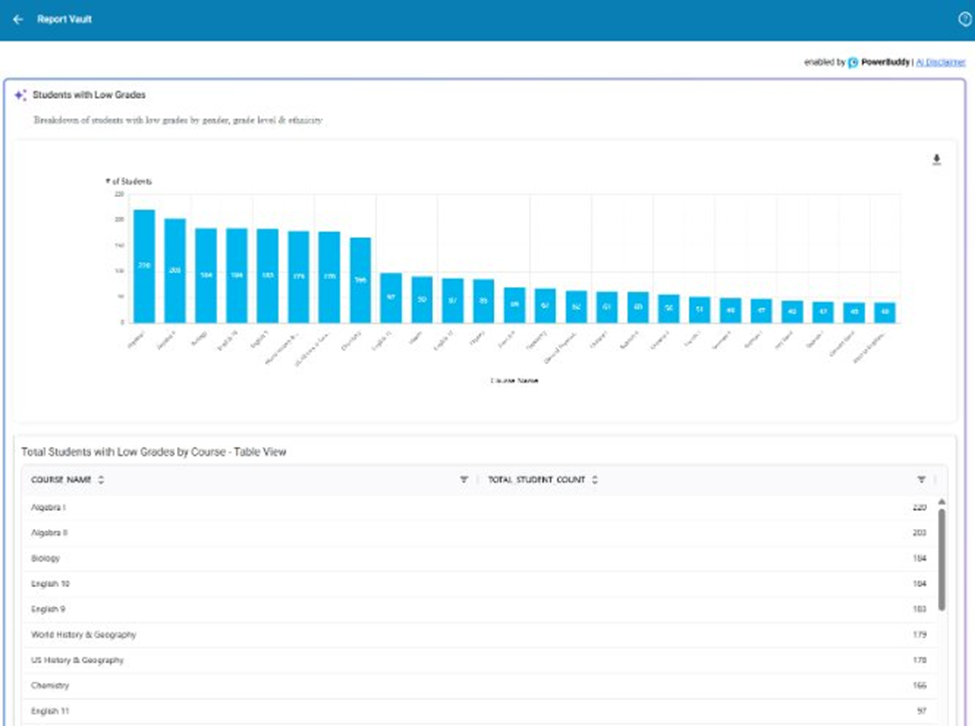
Generate report
The report generation page provides options to further analyze the data that has been retrieved.
Users can
-
Add multiple charts to report
-
Customize charts (titles, labels, sorting)
-
Generate multiple chart versions
-
View data grids of the chart
-
Reorder, preview and save reports
Consider Report generation as a workspace to explore and refine charts. Users can iterate, compare, and select only the final set of charts to include in the saved report.
-
It automatically loads a default visualization based on the results produced on the Data dashboard.
-
Click the table icon to view the tabular data behind the chart.
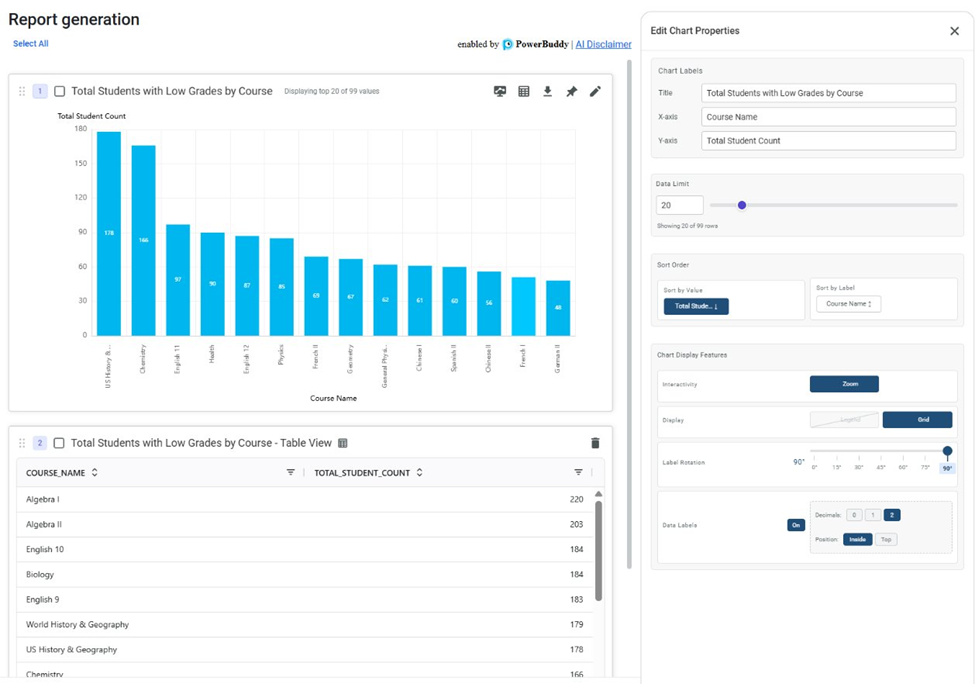
Edit chart properties
-
Click edit icon on the chart to edit the chart titles, labels, sorting, zoom, legends, gridlines, and label placement. Use these controls to improve readability and avoid overlaps in the saved report.
-
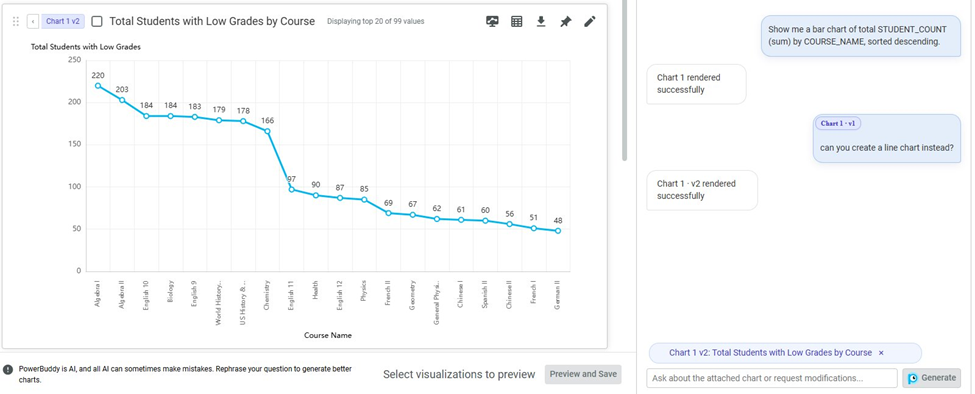
Chart type icon lists some of the suggested chart types based on the data. Users can also close this and ask a natural language question to generate a different chart type.
-
Pin a chart to ask follow-up questions specific to that chart. Use this to change chart types, colors, or how the data is visualized. Pinning a chart generates new versions within the same chart cell, allowing you to compare and select the preferred one for the final report.
Unpin to ask new questions and generate additional charts in the workspace.
-
Reorder charts using drag and drop. The final order is preserved in the saved report.
-
Ask new natural language questions to generate additional charts from the same data. retrieved on Data dashboard.
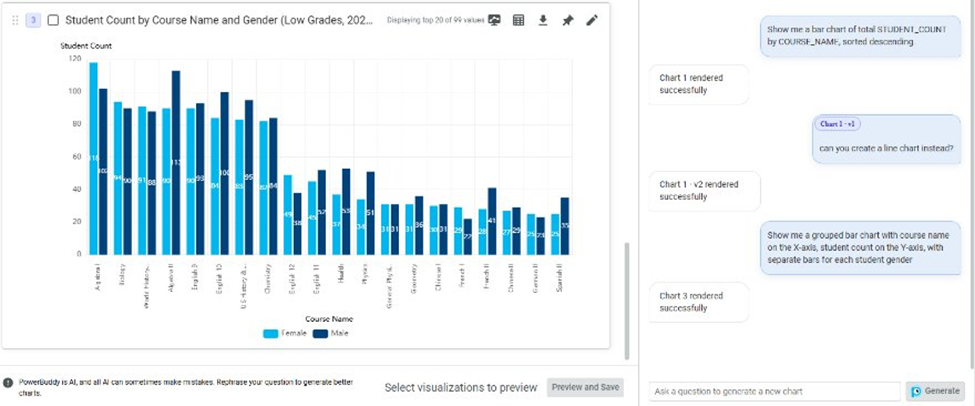
Report generation does not add new fields or modify the data - it visualizes what was retrieved on the Data Dashboard.
-
Users can iterate by generating a different chart type or re-visualizing the data until satisfied.
-
Select the charts to include, then click Preview & Save to preview the report before saving.
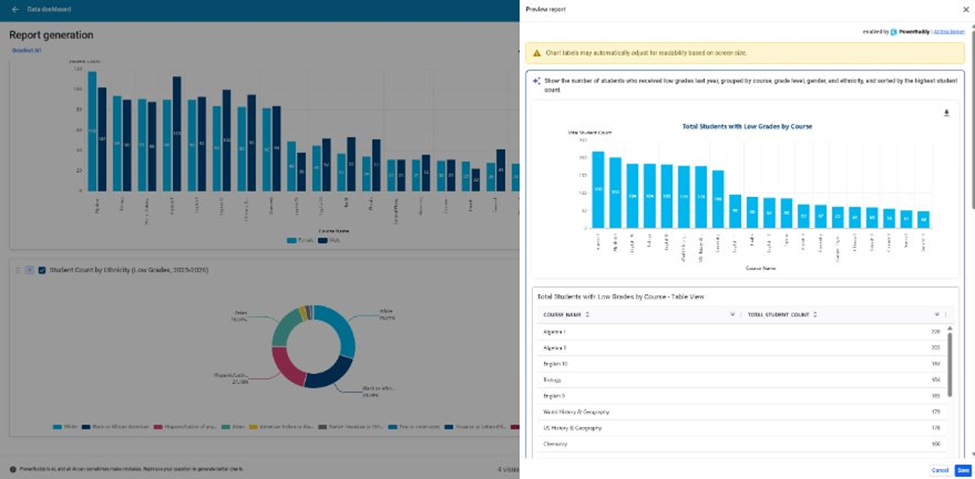
-
Saved reports are available in the Report Vault.
Note: PowerBuddy supports many chart types, with usability improvements primarily focused on bar, line, and pie charts, with additional improvements planned in the future releases.
Executive Summary and Insight
The report page also provides the summary and insights into the data, highlighting distribution patterns and important details that help in understanding the overall composition of the dataset behind the visualizations.
Charts cannot be interpreted by PowerBuddy for Data Analysis, and it cannot provide suggestions based on visual representation. The capacity is limited to the underlying data in the tables.
Save report
Users can now save reports (charts, and insights) just like queries.
To save a report,
-
On the Report generation page, click the Save button.
-
Enter a Report Name, add tags and a description.
-
Saved reports will be available in the Report Vault for easy access.
Note: If you would also like to save the underlying SQL query, it must be saved separately in the Question Vault by clicking Save SQL on the Data Dashboard.
The SQL query behind a report is not saved automatically in the Question vault. To save it, use Save SQL on the Data Dashboard. Users can still view the SQL for any saved report in the Report vault by selecting the menu (three dots) option.
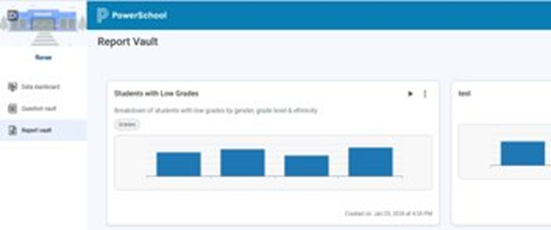
Report vault
Report vault is the central repository for managing and accessing all saved reports in one place. Clicking Run opens the report in a new window within Report vault, with the latest data for the saved charts and insights.
User feedback
Users can provide feedback on displayed results in the Data Dashboard, on generated SQL in the Review SQL page by clicking the thumbs up or thumbs down button.
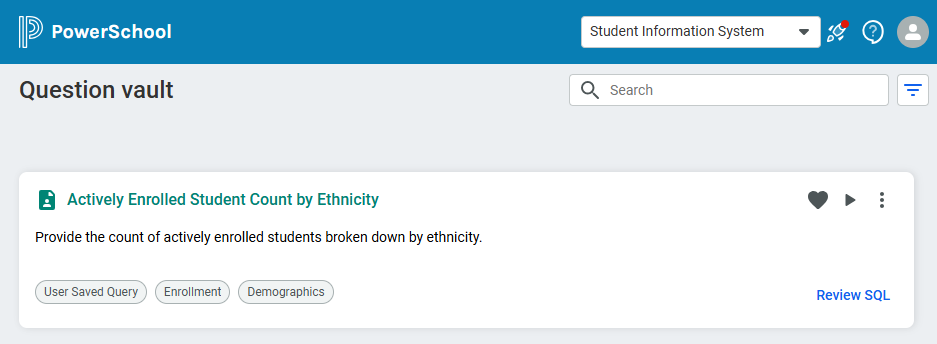
Question vault
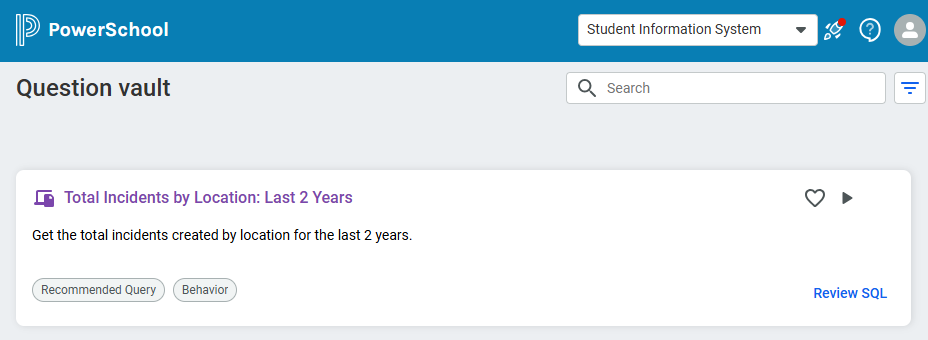
The Question vault page displays the list of all sample, recommended and queries saved by the users on the customer account. These are specific to each product.
The Search field can be used to find any saved query based on keywords from the saved Question name or Question. The search results display a list of saved queries that has high similarities with the keyword you entered.
You can review the saved SQL queries by clicking Review SQL, then edit the query, if needed, by clicking Edit SQL. Click Run button to automatically run the saved SQL query.
The Question name and Question associated with any SQL query saved by the users, can be updated by clicking Update. Click Delete to remove the saved query.
Logout