
Assessment reporting within Courses provides immediate feedback on student and item performance for assessments and helps drive instructional decisions.
After students submit an assessment, results are in near real-time. Instructors can navigate to Reporting from within the assessment to review results.
Course assessment item analysis
Item analysis provides detailed insights into student performance on individual assessment items and overall assessment results.
After students complete an assessment, you can access item analysis from the Reporting area to quickly review:
-
Overall student performance
-
Average item performance
-
High-, medium-, and low-performing items
-
Student performance on each item
Reports include student responses for multiple-choice and true or false questions. You can also review answer distributions and metrics such as average score and total points.
Data is updated in real time for applicable graded assessments and reflects scores that count toward the final grade. Override scores are displayed in the overall graphs but are not in the View All Students details.
You can analyze assessment data by student scores or item performance, and filter results by section as needed.
Calculation of results
Assessment results use standard statistical methods to summarize performance.
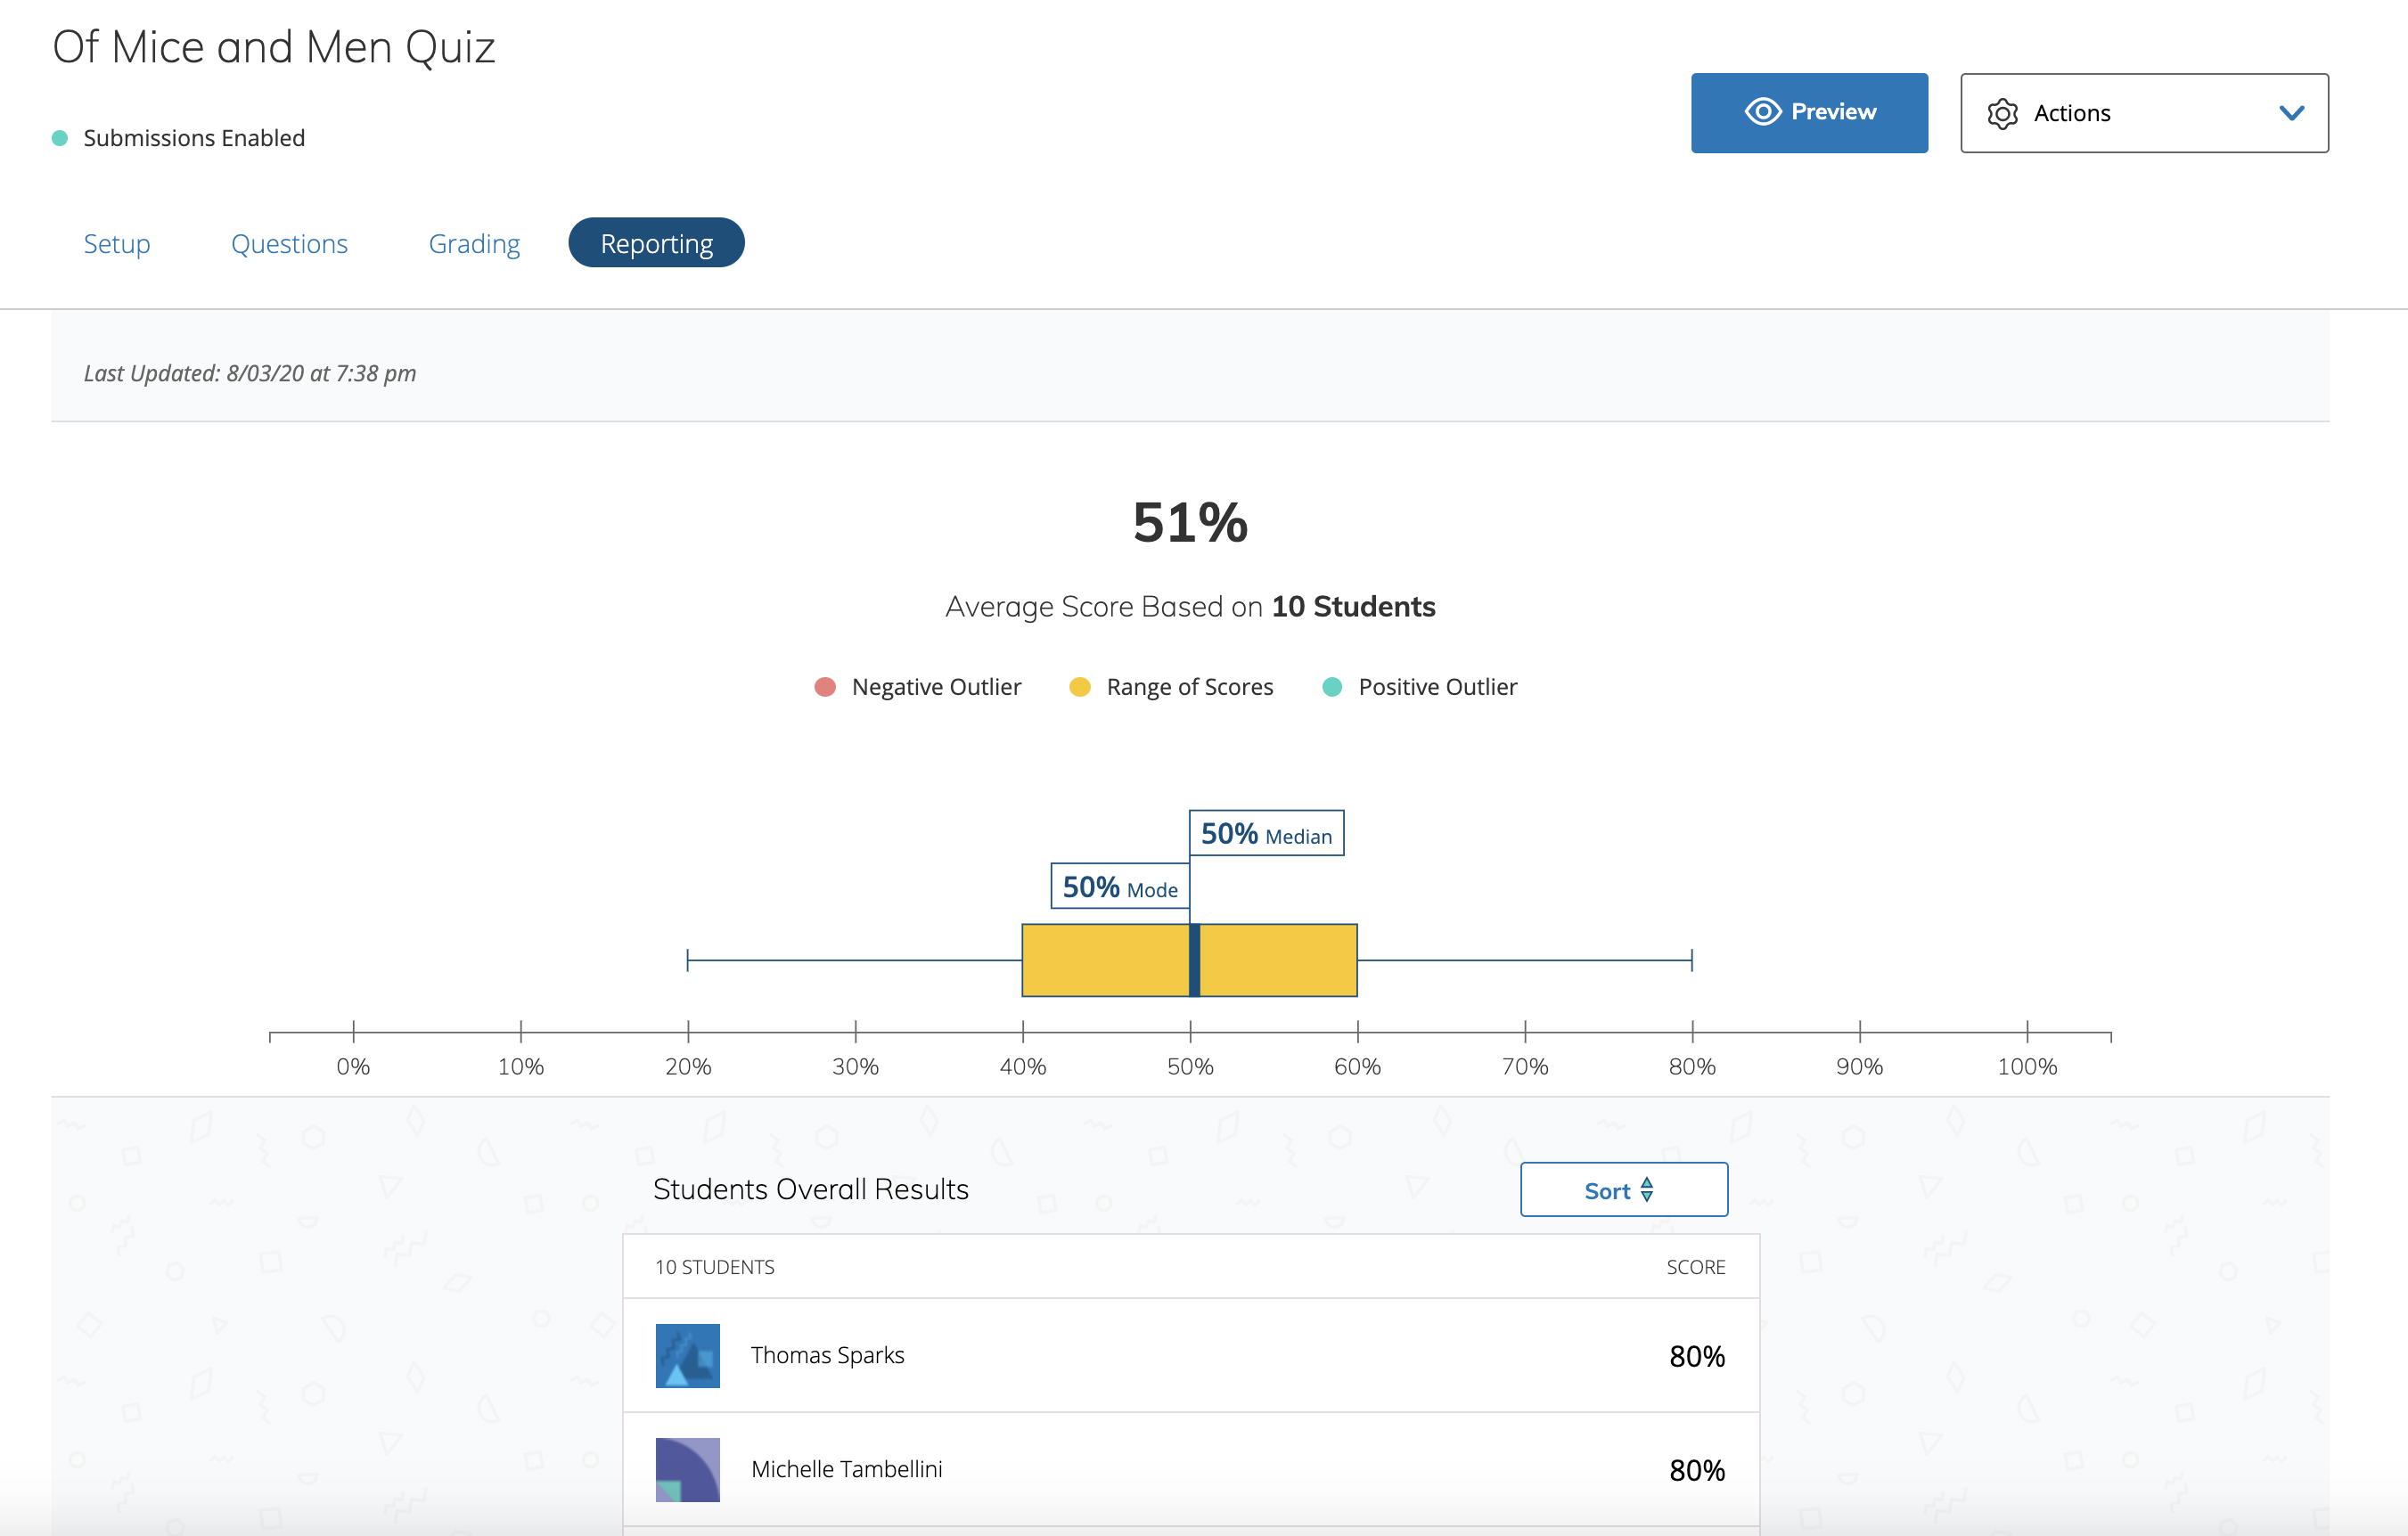
Score distribution (box and whisker plot)
When there are enough submissions, results are displayed using a box and whisker plot. This visualization summarizes performance using five key values:
-
Minimum
-
First quartile (Q1)
-
Median
-
Third quartile (Q3)
-
Maximum
The visualization works as follows:
-
The box represents the range from the first quartile to the third quartile.
-
A line inside the box marks the median score.
-
Whiskers extend from the box to the lowest and highest values that are not outliers.
Outliers
Outliers are scores that fall significantly outside the typical range.
A score is considered an outlier if it is more than 1.5 × the interquartile range (IQR) above or below the first and third quartiles.
Example:
If the box spans 66–78, the IQR is 12.
Any score more than 18 points above 78 or below 66 (1.5 × 12) is considered an outlier.
The calculation method for box and whisker plots cannot be customized.
All students results
Open the assessment, select Reporting, and click View Item Performance.
Results are shown based on the number of submissions:
-
With 5 or more submissions: a box and whisker plot displays class distribution along with summary metrics.
-
With fewer than 5 submissions: each student’s score appears as an individual data point. Selecting a point shows the student and their score.
Class-level metrics include:
-
Class average – average of all student scores
-
Class median – middle score in the dataset
-
Class mode – most frequently occurring score
-
Negative outliers – scores below the lower quartile range
-
Positive outliers – scores above the upper quartile range
-
Last updated – time the most recent submission was recorded
-
Student results – list of all student scores
Item performance
Open the assessment, select Reporting, and click View Item Performance.
Items are grouped by performance bands defined at the system level.
-
Deleted items from the original assessment display an alert indicator.
-
Items added after assessment creation appear after a student responds to them.
-
Selecting an item opens details such as the question, total points, and answer type.
.png?cb=2da76175c6ebf9fb6c43a9c2ee5bbd6d)
You can also export reports for deeper analysis. Click Export Report to run an item performance and student performance report. From the notification, click Transfer History to access your report. After the report status shows Completed, click the gear icon, and select Download.
Access on mobile
Assessment reporting within Courses is not available in the mobile app. However, you can access reporting using a mobile browser.