
Overview
Use the Compare Assessments tool to understand performance over time and across schools so you can assess whether district and school efforts have been effective at increasing student knowledge and understanding.
The Average Score Comparison Report and Student Growth Comparison Report allow AMP administrators to compare up to four managed assessments simultaneously.
A total of 15 permutations will display in each comparison graph. For example, you can compare 15 schools or 15 instructors, or a combination, such as 5 schools and 10 instructors. To compare more than 15 schools or instructors, review the data table below the graph. The graph will not display more than this to ensure the accessibility of the visual results.
Compare managed assessments
Depending on your AMP Analytics permissions, you can compare the average score on managed assessments that are distributed within your school building and instructors, or you can compare the scores across all buildings and instructors. These average scores are also compared to your district average, which is indicated by a star.
-
Select AMP and choose Assessment Reports.
-
Click Compare Assessments.
-
Enter a report name, select Average Score Comparison Report, and click Next.
-
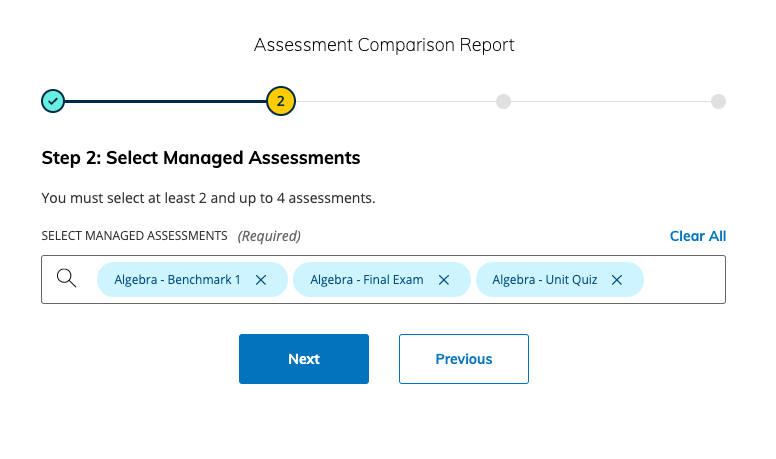
Select between 2 and 4 managed assessments to include in the report.
-
Select the date range to compare and drag-and-drop the order of the assessments for the comparison.
-
The date range reflects the period during which assessments were submitted.
-
If there were no submissions to the managed assessments during the selected date range, no data will populate these reports.
-
-
Click Create Report to confirm and generate your report.
-
AMP data takes 24 hours to populate, so student submissions scored within the last 24 hours do not factor into the report.
-
The report displays the list of instructors alphabetically by last name.
-
The comparison graph and table always display the district average.
-
You can add instructors and schools to the comparison and review those averages.
-
Averages respect the assessment-level setting to score based on the latest attempt or the attempt with the highest score.
Review student growth across managed assessments
The Student Growth Comparison Report allows instructors and administrators with AMP access to review individual student performance on multiple managed assessments.
-
Select AMP and choose Assessment Reports.
-
Click Compare Assessments.
-
Enter a report name, select Student Growth Comparison Report, and click Next.
-
Select between 2 and 4 managed assessments to include in the report.
-
Select the date range to compare and drag-and-drop the order of the assessments for the comparison.
-
This date range reflects the period during which assessments were submitted.
-
If there were no submissions to the managed assessments during the selected date range, no data will populate these reports.
-
-
Click Create Report to confirm and generate your report.
-
Optionally, filter by School, Section, and Instructor to make growth comparisons.
The report is displayed as a box and whisker plot (box plot), which summarizes student scores using five key numbers and highlights any outliers. Box plots are useful because they make it easy to see score ranges, medians, and unusual results at a glance.
Five-number summary:
-
Minimum – lowest score that is not an outlier
-
1st Quartile (25th percentile) – start of the box
-
Median (50th percentile) – middle score, shown as a line inside the box
-
3rd Quartile (75th percentile) – end of the box
-
Maximum – highest score that is not an outlier
How to read the plot:
-
The box shows the range between the 1st and 3rd quartiles (the interquartile range or IQR).
-
The line inside the box marks the median.
-
The whiskers extend to the minimum and maximum values that are not outliers.
-
Outliers appear as individual points outside the whiskers. A score is considered an outlier if it is more than 1.5 × IQR above the 3rd quartile or below the 1st quartile. For example, if the box spans from 66 to 78 (IQR = 12), outliers are scores below 48 or above 96.
The calculation method for box and whisker plots is fixed and cannot be customized.
-
AMP data takes 24 hours to populate. Therefore, data from student submissions scored within the last 24 hours are not in the report.
-
The report displays the list of students alphabetically by last name.
-
The calculation method for each box and whisker plot cannot be customized.
-
Averages respect the assessment-level setting to score based on the latest attempt or the attempt with the highest score.