
Use Scoreboard to compare course, teacher, school, and district averages for all students and their demographic groups.
|
Primary purpose |
Guiding questions |
|
|---|---|---|
|
To compare course, teacher, school, and district averages for all students as well as their demographic groups |
What teachers are having success in which class or with which group of students? What is the breakdown of student numbers in the classes and groups? Is there unwanted disproportionality in the scheduling? Which schools or teachers are most successful in moving students to a proficient level? How did my district, school type, school, and grade perform on this year's Benchmark Assessments? How did my students perform on state tests based on courses and grades grouped by the teacher? How did my school, teacher, and courses perform on local assessments? On state tests? How can we identify which teachers need professional development to improve their instructional strategies for teaching a specific subject or topic? How is the school or district performing on state assessments? Critical local measures? Valued 3rd party measures? Specific standards? What historical patterns in my data will help me identify my SGO population? |
|
|
Primary users |
Primary uses |
|
|
Teachers School Administrators |
Monitor proficiency levels by selected school and teacher/ course Monitor proficiency levels by group Compare proficiency levels at a selected school with the entire district |
|
Access Scoreboard
-
From the main navigation menu, choose Reports, then Scoreboard.
You can adjust the size of the folder menu by dragging the sidebar. Your permissions determine what is displayed in the folder menu.
Select assessments
To select assessment data, access the folders or use Search.
-
Type in the assessment's name in Search, or click the light triangle to expand a folder. Click the dark triangle to collapse a folder. If you limit the display by searching, clear the Search field to restore all displayed folders.
You can use search expressions when filtering to specific assessments or measures.
|
Expression |
Example |
Results |
|---|---|---|
|
or |
FCAT or FSA |
Display folders/ measures containing both FCAT or FSA |
|
not |
FCAT not science |
Display folders/ measures containing FCAT but not science |
|
and |
Score and 10-11 |
Display all results containing both "Score" and "10-11" |
-
Click the plus icon to add a measure to the report.
In the displayed measures, the number of results available is displayed in blue before its title, and the school year follows the title.
-
Remove a column by clicking x in the column heading.
-
For a quick selection of demographic comparisons, click on the ellipsis, then select to add comparison columns.
Review data results
Results are displayed hierarchically, beginning at the district level and ending at the student level. Use student filters to narrow to a specific population. Use the triangle icons to expand/collapse rows to the desired level for comparison. Click on a student name to access their Student details report.
When using the student filters, consider the following:
-
When filtering for students, the student population is limited, but any classes, teachers, and schools associated with those students are still displayed.
-
When filtering for a specific teacher or class, the population is limited to only that teacher or class.
-
If multiple filters are used, the results will display all classes, teachers, and schools associated with the available student population.
Your role will determine the data available to you.
-
Teachers can access their students, classes, and totals for their assigned school(s) and district.
-
School-level users can access students, classes, and teachers of their assigned schools and totals for their schools, other schools, and the district.
-
District-level users can access all students, classes, teachers, and schools.
Select filters
Use filters to select specific schools, teachers, and groups of students.
Report- and column-level filters
In Scoreboard, Add Student Filter behaves differently when accessed in the first column. When clicked in the first column, it adds report-level filters to Scoreboard. If clicked in an assessment column, it adds column-level filters.
Report-level filters
Click Add Student Filter on the Schools, Teachers, and Students column to add report-level filters.
When using report-level filters, consider the following:
-
When filtering for students, the results displayed will be limited to the selected student population, but any classes, teachers, and schools associated with those students will still display in the list
-
When filtering for a specific teacher or class, the results displayed will be limited to only the students associated with that teacher or class
-
If multiple filters are used, the results will consist of all classes, teachers, and schools associated with the available student population
Column-level filters
Click Add Student Filter on an added assessment column to add report-level filters. Use these to compare student populations on the same assessment side-by-side.
Before comparing data for different student groups, ensure the report has at least two columns showing the same assessment.
Use student filters to choose the students you want to display in a report. Follow this procedure to filter students, use a saved student filter, create a new saved student filter, or update an existing saved student filter.
-
Click Add Filter.
-
To use a saved filter, choose from the Saved Filters. If you select a saved filter, you can skip to step 10 and apply the filter or add more filter selections in the following steps.
-
Click a category tab to display the related filters.
-
Click an available filter to display its options. In the following diagram example, the Gender filter is selected in the Demographics category.
-
Optionally, use the Search to narrow the scope of options.
-
Select the desired filter options. In the diagram, the F (female) filter is applied.
-
Optionally, select additional filters from the tabs as needed.
-
If you use a saved filter, click Update Filter to make changes. You can only update filters to which you have update permission.
-
If you want to save your current filter selections to use later, click Create New Filter and follow the prompts to name the filter.
-
Click Apply to add the filtered choices to the report.
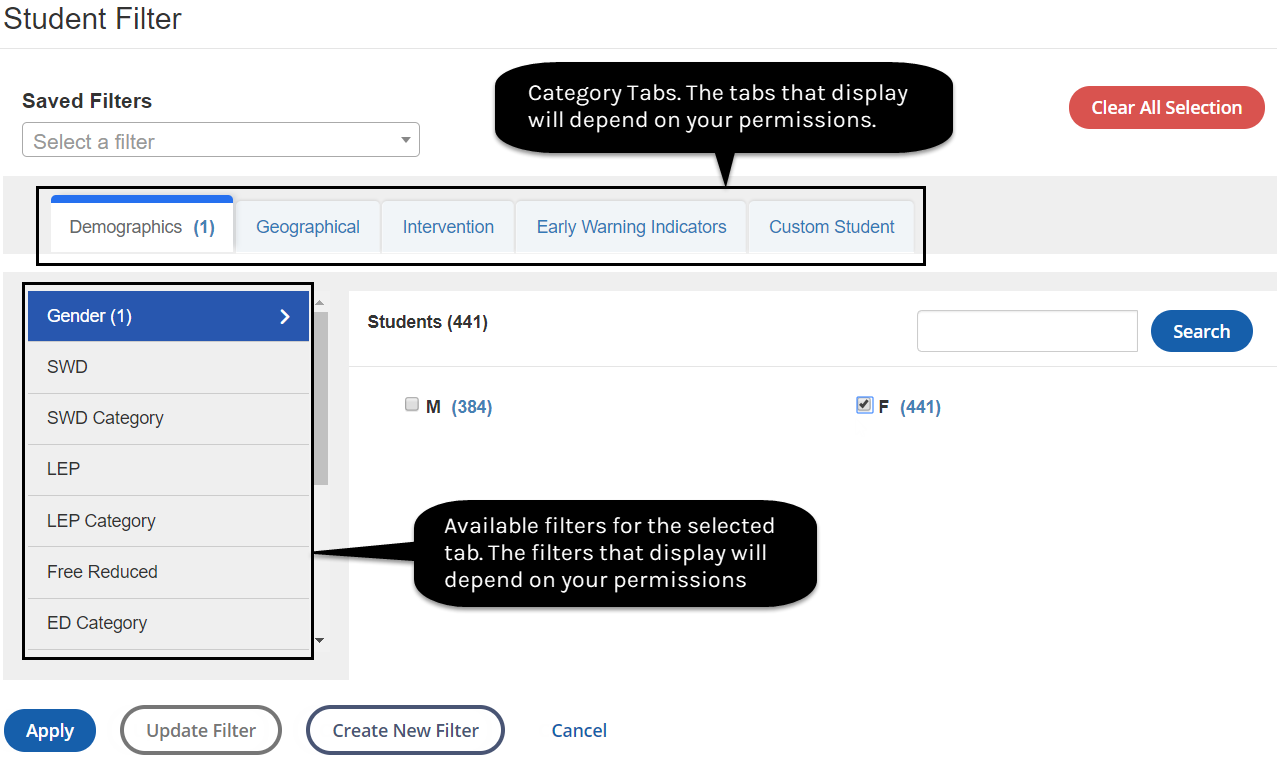
The numbers in parentheses indicate the number of selected attributes. For a category tab, the number in parentheses indicates the number of related filters you selected. For a filter, it indicates the number of options you selected. For a filter option, it indicates the number of students. The number of students displayed by a filter option takes other selected filters into account.
All applied filters are displayed in blue. Click Add Student Filter again to add more filters.
To remove a filter, click x.
If more than three filters are selected, an ellipsis displays, followed by the number of additional filters set.
Hide rows
Select the Hide rows without scores checkbox to hide blank rows. This hides rows with no data across all columns. The one exception is that blank rows at the student level are not hidden. This lets you review who has or has not been scored for the assessments.
Each column displays:
|
Name |
Description |
|---|---|
|
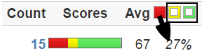
Count |
The number of students who have a test score for the selected test. |
|
Scores |
The number of students in the selected student group who fell within each score range, based on the test threshold and mastery values. Hover over each color to display the student count. |
|
Average |
The average score of students in the selected student group. |
|
Performance Band Swatching |
The percentage of students whose scores met the selected performance bands, represented by color swatching boxes. By default, all performance bands are active, and therefore, the percentage totals 100%. The performance band cuts and colors are determined by the performance band assigned to that assessment. Click a performance band cut (color box) to add or remove students in that performance band from the percentage count. When the center of a box is white, its students are removed from the percentage indicated. For example, remove the yellow and green scores to reveal that 27% of students did not meet the threshold for this assessment.
|
Share or download a report
Share a scoreboard report
Click Share to generate a shareable link to the current report display. You can share the report with other credentialed users. Users must be logged in, and they can only review the data and students they have permission to display. The link will display a dynamic report with current data each time it is accessed. Copy and paste the URL to share the report.
Download a scoreboard report
Click Download to export the current report display to a spreadsheet that you can save and print as needed.
When you export to a spreadsheet, the data is static. Additionally, the content reflects your display permissions. It is important to keep this in mind if you share a downloaded report.