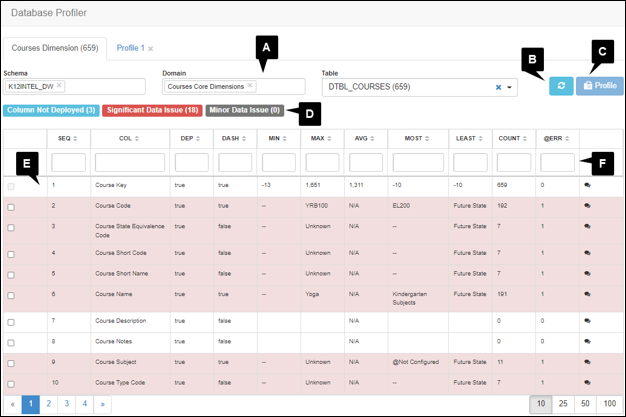
Use the Data Profiler tool within the Data Model Explorer to review summary column statistics and conduct data profiling on selected columns.
Launch the data profiler
To open the Data Profiler tool, click Data Profiler in the Metadata view panel. Use the following tools and elements to review and interact with the data.

-
The Schema, Domain, and Table data filters are automatically populated with the information from the table used to launch the Data Profiler. Click the x to remove a filter. To add a filter, click the filter field and choose an option from the list.
-
Click Refresh to rerun the summary statistics.
-
Click Profile to build the data profile based on selected columns.
-
Summary of data issues.
-
Column Not Deployed indicates new columns in the current data model that do not exist in the deployment.
-
Significant Data Issue indicates columns with a proportionately large number of @ERR values.
-
Minor Data Issue indicates columns with data issues that are not significant.
-
-
Displays the columns contained within the table and their summary statistics.
-
Use the column filters to filter and sort column information.
Create a data profile
Use data profiles to review what data is stored in selected table columns. You can create as many profiles as you want. Profiles are retained for the duration of the session or until closed.
To run a data profile:
-
Select the box for each desired column.
When multiple column pages exist, use the page controls to navigate to additional columns or adjust the number of items per page.
-
Click Profile.
-
Select the newly generated Profile tab to view the results.
-
The executed data profile includes a column for each selected column in the table view.
-
An additional Count column lists the unique number of occurrences of the combination of data values.
-
