Student item analysis
The Student Item Analysis report analyzes assessments by students at the item level and compares class performance to school and district performance. Analysis data is displayed using summary charts and scores tables.
Primary Users | Primary Uses | Guiding Questions |
|---|---|---|
|
|
|
Access student item analysis
Results display only for students to whom you have access.
From the main navigation menu, choose Reports, then Student Item Analysis.
Choose a Test Title.
Test selection:
honors filters set for the school, teacher, course, or class
only includes released tests
includes only those with generated and loaded student data
Filter options
Click Additional Filters, then choose from the following options:
Add Student Filter - Choose from the Student Filters to limit the student population. Setting filters for school, teacher, course, or class limits the test selection choices.
Active Filters - Indicates the filters that are currently applied.
Test Window - This filter is only available if the test has multiple test windows. You can choose multiple test windows; however, if you choose only one, the displayed results are from the most recent test window.
Correct a response or score
Update student responses to correct scoring discrepancies. This is useful for interaction types like text entry, which may not have enough correct answer variations to capture all responses the teacher wants to count as correct.
To correct responses or scores, student response editing must be enabled for the test.
To change this setting, you must have Update permissions on the test. This option is enabled by default for teachers who build private tests.
In the Item Scores or Interaction Scores table, choose the cell containing the score that needs to be updated.
Select Edit Response.
Update the student response. If appropriate, this also updates the student's score.
This process can only be used to update machine-scored interaction types. While responses to rubric-scored items may be editable, the score is not updated. To update rubric scores, use the scoring assignment for the test.
Save your changes.
You must refresh your browser to review an updated score in the scores table.
Create a new shared report
Click Save to create the shared report.
Enter the Description.
Click Save.
If the information is correct, click Permissions.
Click Add user or group.
Add individual users by name or role. To add multiple users or groups at once, click and hold the Control key on a PC or the Command key on a Mac.
Click OK.
Select permissions for each displayed group.
Assign Read access to the district to share this report with the entire district.
Click Save.
Click OK.
Export results to your gradebook
Export assessment results to your Gradebook account.
Before exporting assessment results, you must filter to a single class. You can only submit student scores for one class section at a time.
Gradebook is only available for teachers with access to PowerTeacher Pro or eSchoolPlus.
Choose Gradebook.
Enter the required information.
If the test has previously been sent to Gradebook, then all required attributes are auto-filled and disabled.Click Submit.
Summary charts and scores tables
Student Item Analysis contains two sections that include summary charts and score breakdown.
You can choose from the following actions when reviewing:
Sorting - Click on a column header with a double-arrow to sort by that column.
Export - Export the current display of the tables, honoring any filters selected.
Click Excel to export a Microsoft Excel file with tabs for Item Scores and Interaction Scores, including full tables and color-coding.
Click CSV to export a basic Interactions Scores table.
Opening the CSV file with Excel or another spreadsheet application may result in improper formatting of cell data. Format the cells as text for an appropriate overview of the data.
Click Share to create a custom link that can be copied and shared with other users. The link includes any selected student filters.
Reviewing the content of a high-stakes test or any of its items requires a user to have high-stakes administrator permission. Only an administrator can assign high-stakes administrator permission to a user or group.
Hover over an item to review its statistics.
Summary charts
Summary charts are organized into three tabs: Item Attributes, Performance Bands, and Item Detail.
Item attributes
The Item Attributes tab includes the standards assessed on the test and the percentage of students in each performance band assigned to that assessment.
Choose an attribute type to display a breakdown of the student percentage:
Hover over a standard to display the full standard description.
Click on a count to filter the results in the score table to only items with that attribute. Click again to clear the filter.
The bars for % of Students are color-coded to match the test's performance bands. Hover over a section of the bar to display the count and percent details. Click on a section of the bar to filter the report by the students represented by that count for that attribute. Click again to remove the filter.
Click a swatching box to include or exclude that performance band in the percentage value displayed in the column.
A solid-filled box means the data for that color band is included. A partially filled box indicates data for that color band is excluded.
The value is the student percentage for all selected performance bands for each attribute.
Hover over an average to display the PE/PP (points earned / points possible).
Some districts may have Professional Development Platforms enabled.
Tests that use standards that are aligned to content from the platform have an icon next to the standard.
The stacked bar graph displays the overall performance band percentages using the test's performance band colors. Hover over a section to display details.
For teachers, this graph includes comparisons across student, school, and district performance. School and district-level users can display these comparisons by setting the school of enrollment and teacher filters.
If you use the school of instruction filter, all three bar graphs for comparison will not display. You must use the school of enrollment filter.
Performance bands
Select the Performance Bands tab to review the student population percentage for each achievement level.
The stacked bar graph displays the overall performance band percentages using the test's performance band colors. Hover over a section to display details.
Select a section of the graph to filter the report by students in that performance band. Click the row again to clear the filter.
Item detail
Select the Item Detail tab to review score or response distributions for individual test items, interactions, and rubrics.
Click the item number in the header.
To display interaction choice distributions, click the bar chart icon. Only available for multiple choice interactions.

The bar chart provides an overview of all possible response scores for the selected item, interaction, or rubric. The graph also provides comparisons across student, school, and district performance. For multiple-choice interactions, the interaction choice displays the answer choice distribution).
Hover over a bar to display the count and percentage details.
Click on a bar to filter the report by students represented by that score.
Choose from the display selector to switch between item, interaction, and rubric levels.
Another chart displays the overall percentage of points earned over the points possible for the selected item.
Hover over the sections of the outer ring to display the total number of students who answered correctly or incorrectly.
Hover over the inner ring to display item details.
Data Point | Description |
|---|---|
Students | Total number of students scored for this item in the currently selected population (based on any filters applied) |
P-Value | Value of 0 to 1; indicates the degree of challenge for items based on the percentage of students who chose the correct answer |
Item Discrimination | Value of -1 to 1; indicates the effectiveness of distractors and pinpoints possible misfits |
Point Biserial | Value of -1 to 1; indicates how well the question tells the difference between high and low performers |
Population | Total number of students scored for this item |
PE | Total points earned for this item by the students in the currently selected population (color-coded based on the test's performance band) |
PP | Total points possible for this item by the students in the currently selected population |
This report includes several item statistics.
Score tables
The score table includes up to four tabs: Interaction Scores, Item Scores, Rubric Scores, and Item Engaged Duration.
Rubric Scores only display if the test includes items that require manual scoring using a rubric.
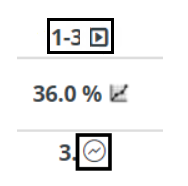
Select the Interaction Scores, Item Scores, Rubric Scores, or Item Engaged Duration tab. If the test contains manually scored interactions, select the Rubric Scores tab to review the breakdown of scores by rubric or scorer for the currently selected student population.
Column | Details |
|---|---|
Student Name |
|
Test Score % | The header displays the overall test score for the student population.
|
PE/PP | Test points earned over the number of points available.
Colors are applied for Answer Key Only tests regardless if rubric-scored items have been scored. Once rubric-scored items are scored, the color changes. |
Section % | If a test contains sections, each section has a column.
|
Interaction Number Columns |
|
Item Number Columns |
|
Rubric Columns |
|
Item Engaged Duration |
|
Understand the scores
Interaction scores
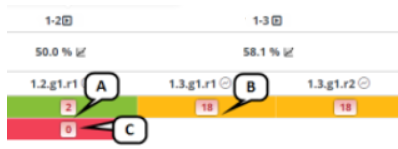
Each interaction is coded according to the performance band. The table below describes how the interactions are displayed:
Interaction type | Response and score | Performance Band displayed |
|---|---|---|
Multiple Choice | Incorrect response- no credit | lowest performance band |
Multiple Choice | Correct response- full credit | highest performance band |
Multiple Choice | No response - no credit | lowest performance band |
Rubric Scored Item | Scored - partial credit | mid-range performance band |
Rubric Scored Item | Scored - no credit Not scored - not factored into the score | none |
Rubric Scored Item | Scored - full credit | highest performance band |
Interaction other than Multiple Choice | Incorrect response - no credit | lowest performance band |
Interaction other than Multiple Choice | Correct response - full credit | highest performance band |
Items scores
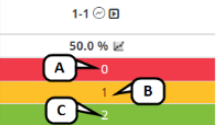
Each item is coded according to the performance band. The table below describes how the item response and scores are displayed:

Response | Score | Performance Band displayed |
|---|---|---|
Correct | Full Credit | highest performance band |
Incorrect | No Credit | lowest performance band |
Not Scored | Not factored into the score | none |
Partially Correct | Partial Credit | mid-range performance band |
Rubric scores

Response | Score | Performance Band displayed |
|---|---|---|
Correct | Full points awarded | highest performance band |
Partially Correct | Partial points awarded | mid-range performance band |
Incorrect | No points awarded | lowest performance band |
If a column is blank and has the label n/a, the item has no student response because a teacher has not yet released this test section to the student, or the student has not completed the assessment, and the teacher has opened the test for online scoring.
Multi-Part Items
Some items may have more than one interaction. The Student Item Analysis report allows you to review the overall score as well as the score per interaction.
Item scores
Click Item Scores to review the overall score for items. This is the total points earned for all interactions in the item. Click the cell to display all interactions and the student's responses.

Performance Band displayed | Response | Score |
|---|---|---|
lowest performance band | Incorrect | No Credit |
mid-range performance band | Partially Correct | Partial Credit |
highest performance band | Correct | Full Credit |
Interaction scores
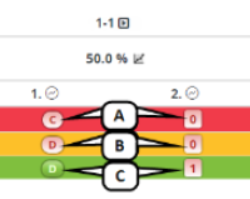
Click Interaction Scores to review the score associated with each interaction. Click on any of the points earned cells to display all the interactions and the student's responses.

Response | Score | Performance Band displayed |
|---|---|---|
Incorrect | No credit for either part | lowest performance band |
Partially Correct | Credit for the correct part | mid-range performance band |
Correct | Credit for both parts | highest performance band |
